Giám sát NGINX theo thời gian thực với Fluent Bit và OpenObserve
1. 📌 Tại sao cần giám sát NGINX?
Khi một hệ thống sử dụng NGINX làm web server hoặc proxy server, việc giám sát thời gian thực giúp bạn:
- Tối ưu hiệu năng: Kiểm soát thời gian phản hồi và tình trạng server.
- Phát hiện lỗi sớm: Xác định lỗi HTTP, truy cập bất thường, hay băng thông vượt mức.
- Theo dõi hành vi người dùng: Phân tích logs để hiểu người dùng tương tác ra sao.
- Quy hoạch tài nguyên: Đánh giá tải hệ thống để mở rộng hoặc phân phối lại tài nguyên.
2. 🔍 Các chỉ số cần giám sát
| 📊 Chỉ số | 🔎 Ý nghĩa |
|---|---|
| Request Rate | Số lượng request mỗi giây – phản ánh tải truy cập |
| Response Time | Thời gian phản hồi – đánh giá hiệu năng người dùng cảm nhận |
| Error Rate | Tỷ lệ lỗi 4xx, 5xx – giúp phát hiện sớm vấn đề |
| Bandwidth Usage | Dung lượng truyền tải – hỗ trợ quy hoạch mạng |
| Active Connections | Số kết nối đang mở – đo sức chịu tải của server |
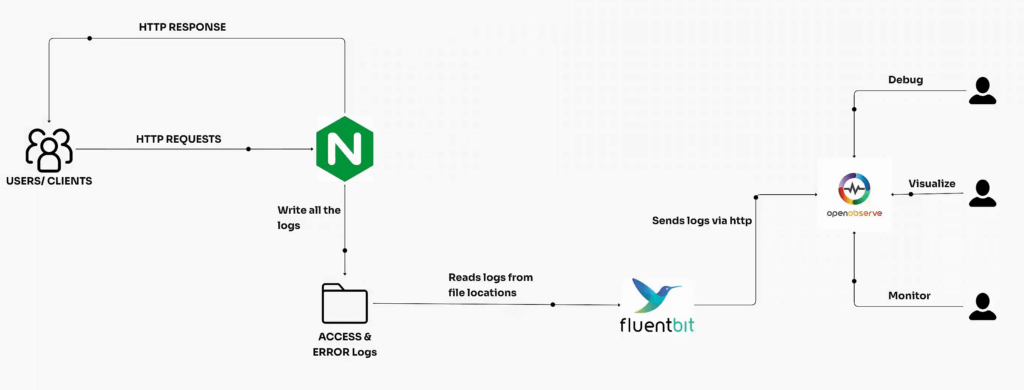
3. 🧰 Kiến trúc hệ thống giám sát
graph LR
    NGINX -->|Ghi log JSON| LogFile[/access.log/]
    LogFile --> FluentBit
    FluentBit -->|Gửi log HTTP| OpenObserve
    User -->|Query log| OpenObserve
4. 🛠️ Các bước triển khai
Bước 1: Cài đặt NGINX trên máy local (macOS)
brew install nginx
sudo nginx
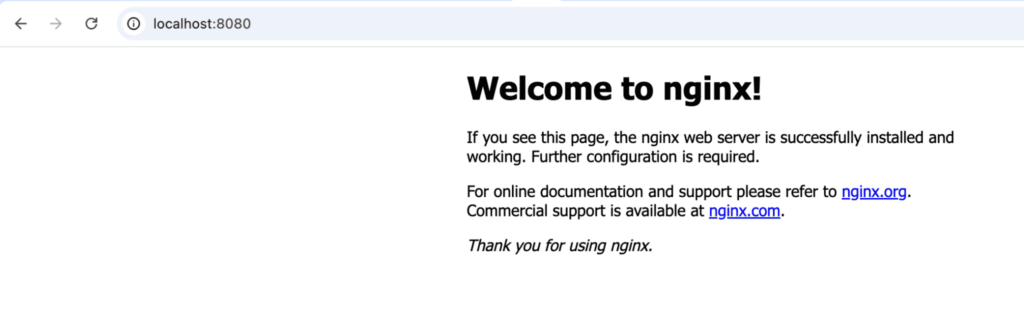
- Truy cập
http://localhost:8080để kiểm tra hoạt động.
Bước 2: Cấu hình NGINX ghi log dạng JSON
Chỉnh sửa file /opt/homebrew/etc/nginx/nginx.conf:
http {
  log_format json_combined escape=json '{"@timestamp":"$time_iso8601",'
    '"remote_addr":"$remote_addr",'
    '"request":"$request",'
    '"status":"$status",'
    '"body_bytes_sent":"$body_bytes_sent",'
    '"http_referer":"$http_referer",'
    '"http_user_agent":"$http_user_agent"}';

  access_log /opt/homebrew/var/log/nginx/access.log json_combined;
}
✅ Lợi ích: Log JSON dễ phân tích hơn, không cần viết regex phức tạp khi gửi lên OpenObserve.
Bước 3: Cài Fluent Bit và cấu hình đọc log
brew install fluent-bit
Tạo file nginx-fluent-bit.conf:
[INPUT]
    Name tail
    Path /opt/homebrew/var/log/nginx/access.log
    Parser json
    Tag nginx-access
    DB /var/log/fluent-bit-nginx-access.db
    Mem_Buf_Limit 5MB
    Skip_Long_Lines On

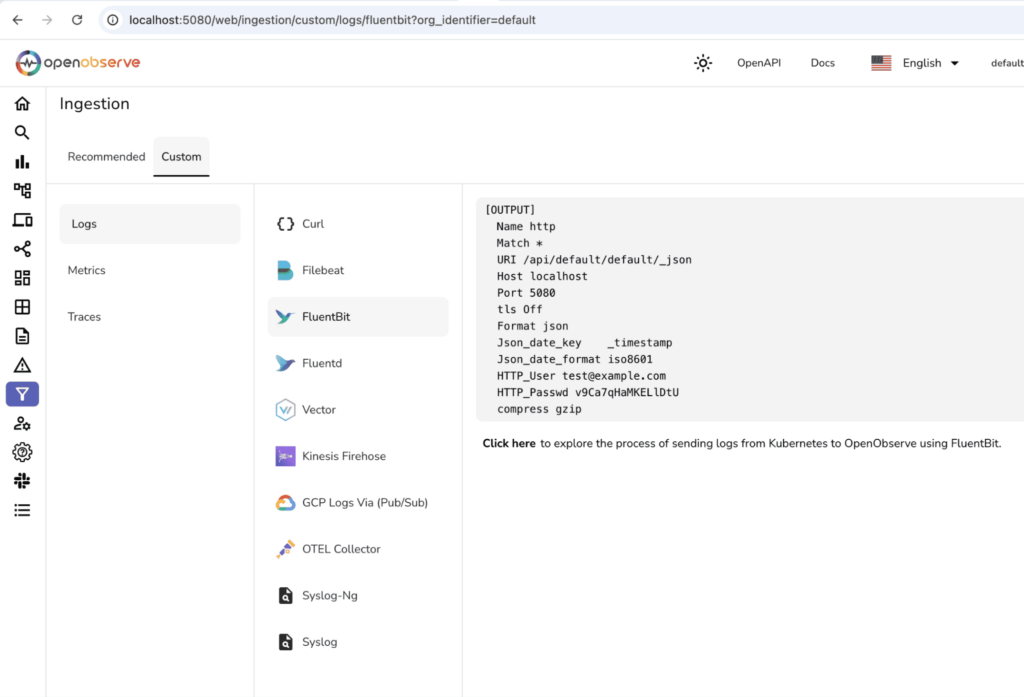
[OUTPUT]
    Name http
    Match *
    URI /api/default/default/_json
    Host localhost
    Port 5080
    tls Off
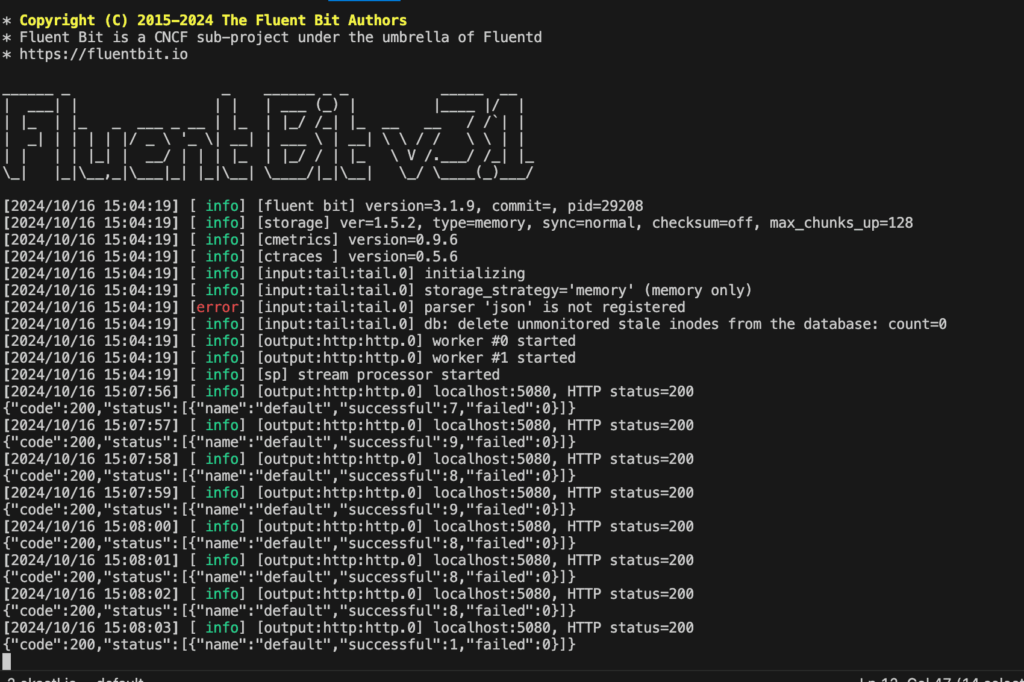
Chạy Fluent Bit:
fluent-bit -c nginx-fluent-bit.conf
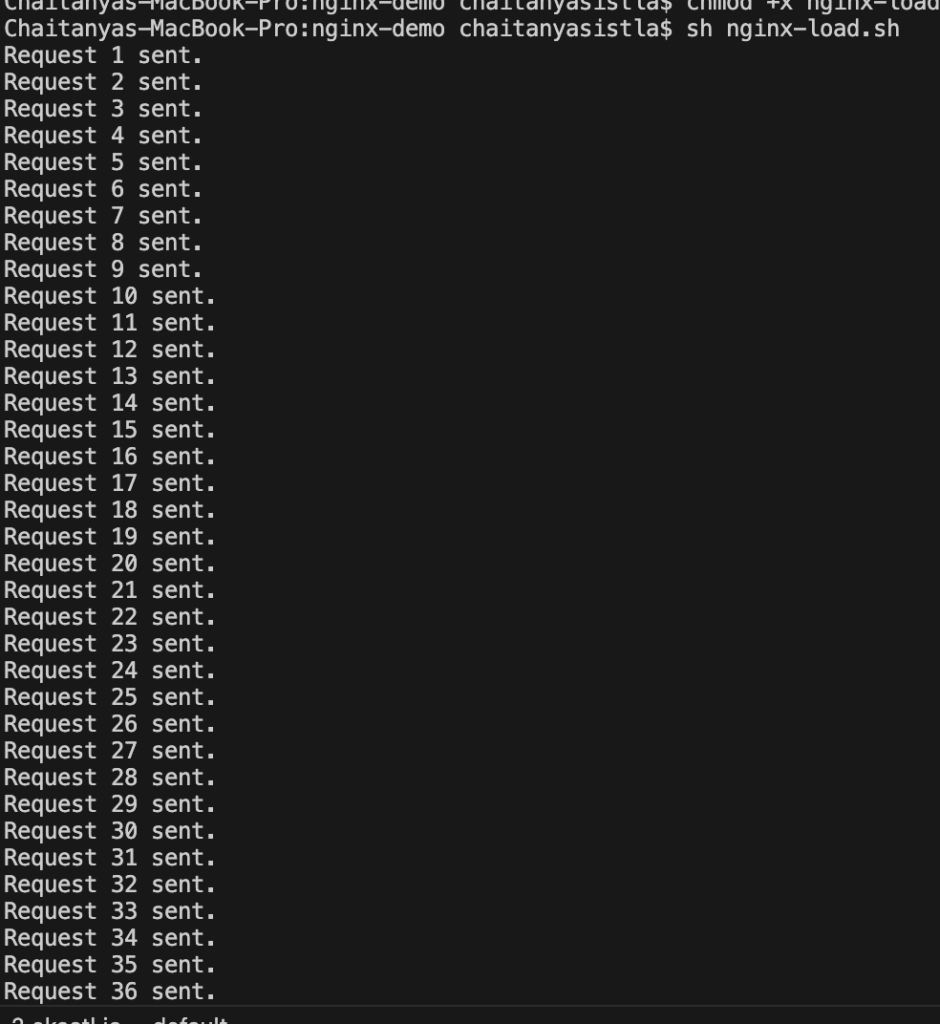
Bước 4: Tạo script gửi request để sinh log
Tạo file nginx-load.sh:
#!/bin/bash
for i in {1..1000}
do
  curl -s http://localhost:8080 > /dev/null
  echo "Request $i sent."
  sleep 0.1
done
chmod +x nginx-load.sh
./nginx-load.sh
Bước 5: Cài đặt OpenObserve
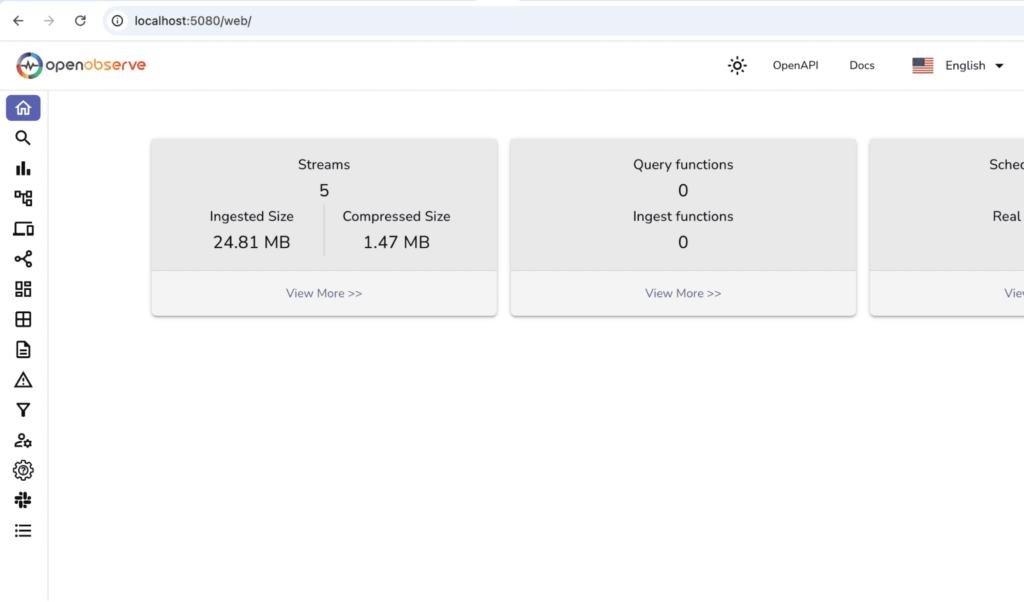
Bạn có thể cài bằng script từ GitHub:
git clone https://github.com/openobserve/rum-demo.git
cd rum-demo/openobserve-setup
./setup_openobserve.sh
Đảm bảo OpenObserve chạy ở địa chỉ: http://localhost:5080
Bước 6: Kiểm tra log trong OpenObserve
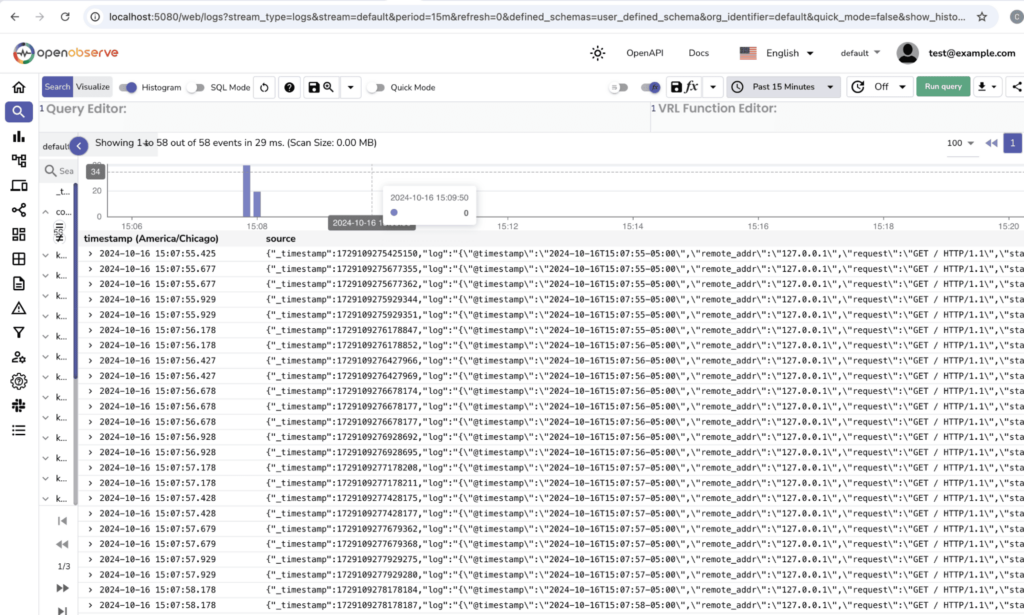
- Truy cập:
http://localhost:5080 - Tìm kiếm với tag:
nginx-access
Ví dụ log mẫu:
{
  "@timestamp": "2024-10-16T15:07:55-05:00",
  "remote_addr": "127.0.0.1",
  "request": "GET / HTTP/1.1",
  "status": "200",
  "body_bytes_sent": "615",
  "http_user_agent": "curl/8.7.1"
}
5. 💡 Kết luận: Khai phá sức mạnh từ logs
Sau khi tích hợp NGINX với Fluent Bit và OpenObserve, bạn đã có một hệ thống:
- Theo dõi log thời gian thực
- Truy vấn dữ liệu linh hoạt
- Phát hiện lỗi sớm
- Hiển thị dashboard trực quan
🎯 Mở rộng thêm:
- Thiết lập cảnh báo bất thường
- Phân tích hành vi truy cập (user agent, referer)
- Tích hợp thêm trace, metrics cho full observability
*💡 Tham khảo* https://openobserve.ai/blog/how-to-monitor-nginx-with-fluentbit-and-o2/